!QCL Solutions

Scalable Solutions for Institutional-Level Trading

For years we have tracked total volume in US Equity Markets. It has been one of our most useful indicators for quickly ranking the significance of daily trading activity. Too often we hear misrepresentations of daily trading activity on major media outlets. So we figured, why not let traders see the truth for themselves – objectively without hype or spin.

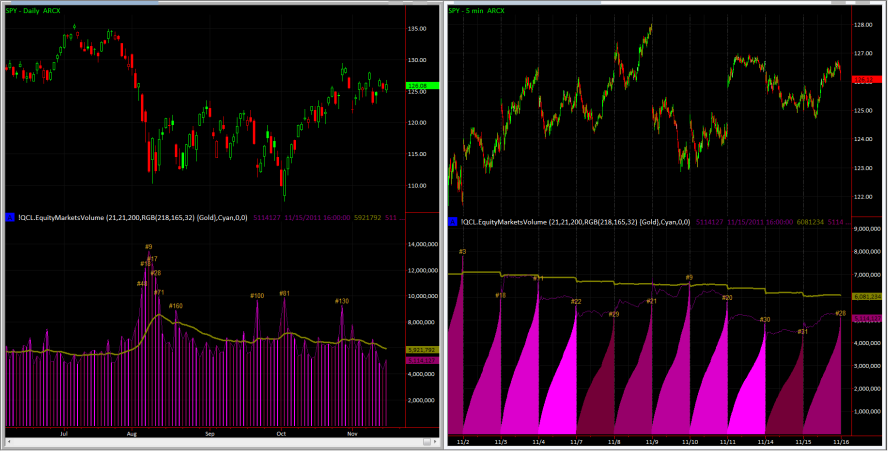
What have been the most active days in US equity markets history? How does today’s activity compare? What total daily trading volume does the current rate of trading project?

In addition to historical records, in real time the EquityMarketsVolume indicator is a powerful forecasting tool. Even after only a few minutes of trading, you get a reliable estimate of what the total trading volume will be for the day, and how the current day compares to history.

EquityMarketsVolume is available on the TradeStation Strategy Network. The demonstration workspace provided with the product is as follows:

EquityMarketsVolume

Let us know if you have any questions.

A new version of MyIndex is to be available on the TradeStation Strategy Network by 11/1/2011. Even though MyIndex properly leaves the handling of data request errors to the TradeStation platform, two new inputs enable the user to specify more precisely how requests for multiple non-linear time series data streams are managed, and how any resulting errors are displayed.

TradeStation does not support multiple non-linear time series data streams for charts. This is seen with a tick chart by trying to insert a second data stream.
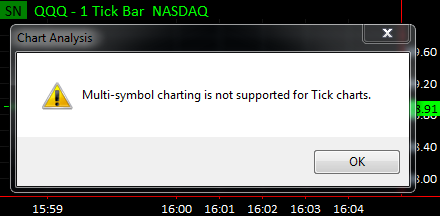
The same multi-data rule for charts applies to data objects in OOEL code, and thus affects the MyIndex indicator. However, currently the TradeStation platform does not raise a multi-data error message when an indicator is instructed to request multiple non-linear time series data streams.

In our testing, this lack of an error message from the TradeStation platform has been innocuous. For example:

  • Opening a Tick chart and inserting the MyIndex indicator plots the closing values of the 1-tick data
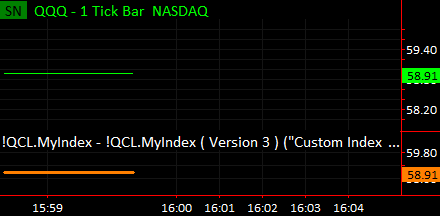
  • Changing the ‘Symbols’ input of MyIndex, so that it has 2 symbols like “AA,AAPL”, in the 1-tick chart, plots the closing values of 1-tick data for “AA”. (Note that “AAPL” is ignored because TradeStation will not provide a second tick data stream.)
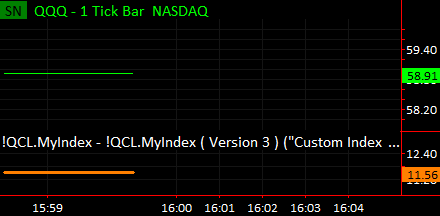
  • Changing the ‘Symbols’ input of MyIndex, so that it has 3, 4, 5, 6, etc. symbols in the 1-tick chart, continues to plot the closing values of 1-tick data for “AA”.
  • Changing the ‘Symbols’ input of MyIndex, so that it has a large number of symbols in the 1-tick chart… at some point, the indicator may not respond. To terminate such a situation, one can simply right-click to ‘Format Analysis Techniques’ and change the MyIndex ‘Symbols’ input, or remove the indicator.
  • If for some reason the platform becomes unresponsive, which is a possibility anytime the platform is running, the platform should be shutdown and restarted as follows:
    • Open your Task Manager and End TradeStation as in the following image:
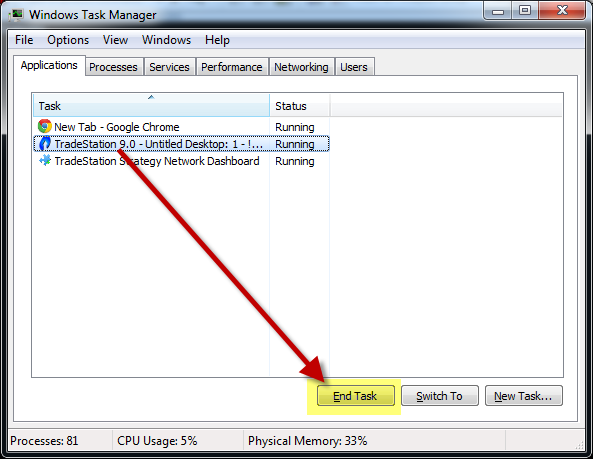
    • Optionally, restart your machine since TradeStation runs several processes that often won’t close by simply closing the platform. (TradeStation Technologies can provide a batch utility to shutdown all TradeStation processes with a click, if you need to do this frequently.)

Since the multi-data error is typically innocuous, as noted above, the current MyIndex indicator handles the  multiple non-linear time series data requests scenario appropriately, by leaving it to the TradeStation platform.

Other reasons to leave the multi-data error handling to TradeStation are as follows:

  • The current TradeStation platform multi-data error handling behavior is likely preferable to most TradeStation customers, since they tend to be experienced with recognizing issues and resolving non-responsiveness (without the need for distracting dialogs).
  • Trying to handle error events for the platform, such as to raise events through the RaiseRunTimeError keyword, can currently lead to platform instability in TradeStation 9.0.
  • TradeStation platform multi-data error handling behavior may change in the future as TradeStation releases 9.0 updates and newer builds.
  • It is possible that TradeStation may at some point support the simultaneous use of multiple non-linear time series data.

In the new version of the MyIndex indicator, we are making the following updates:

  • To avoid multiple non-linear time series data errors, the AvoidMultiNtsData input has been added. The default value is TRUE, so that multiple non-linear time series data requests will not be passed on to TradeStation. In such cases the indicator will return 0 values and will plot “ERROR: Multi-Non-Timed data” in the window status line.
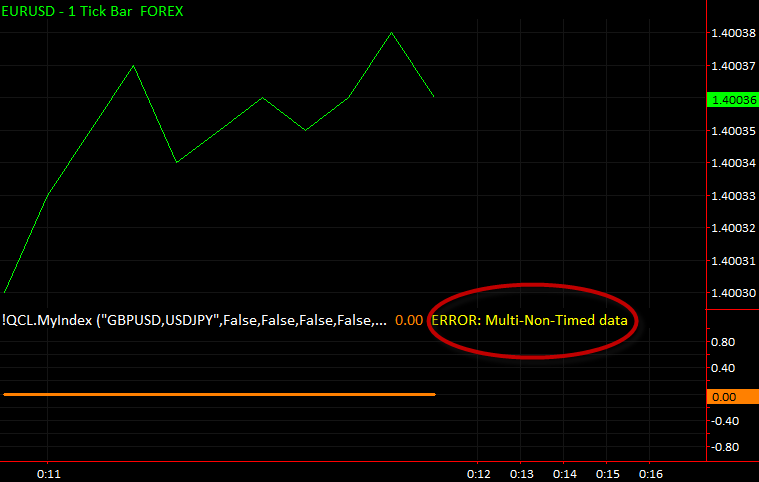
  • By default, a RunTimeError event will not be raised, since this can currently be problematic in TradeStation 9.0. However, RunTimeError events can be raised in such cases, by setting the new DoRaiseEventOnError input to TRUE.

Look forward to version 4 of MyIndex on the TradeStation Strategy Network.

* TIP for Tick chart users
Here is MyIndex plotting GBPUSD 1-tick data below Data1 which is EURUSD 1-tick:
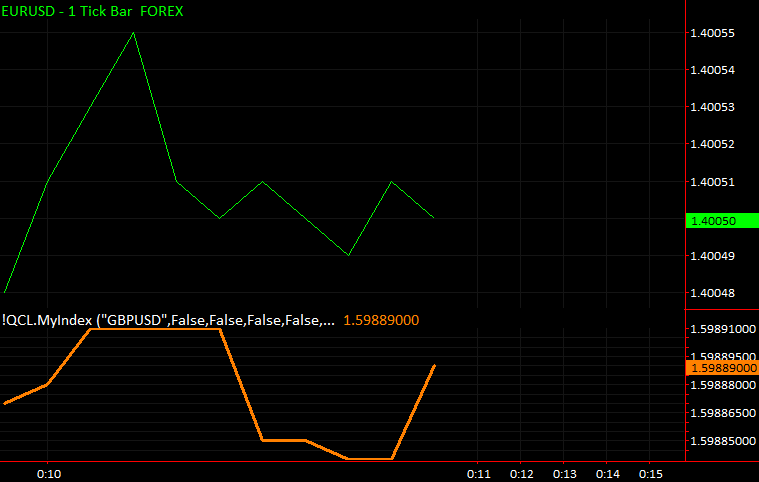

    As long as there is only one Symbol in the ‘Symbols’ input of MyIndex, the indicator can be used with 1-tick charts. This is an interesting application of MyIndex to work around the “Multi-symbol charting” limitation seen in the first image above. TradeStation does not allow plotting of two 1-tick data streams on the same chart, but with MyIndex this can be done.
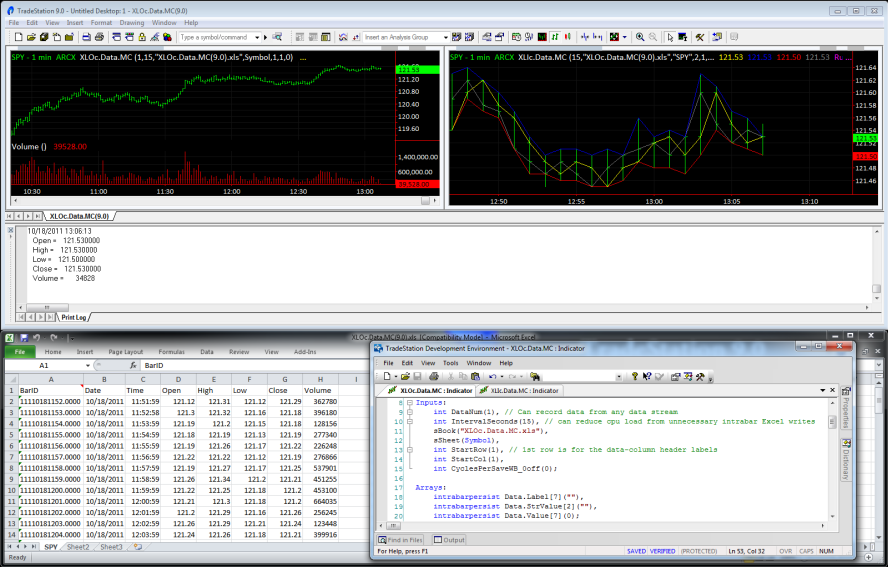
One application of XLInputs is to write data to Excel

See a video demonstration by clicking on the picture below.

In the demonstration, data is being written to a specified Excel workbook with a worksheet named according to the left chart symbol, SPY.

The data being written is Date, Time, Open, High, Low, Close and Volume.

A precise BarID is recorded in the left-most column. This allows the data to be read from Excel by another application.

Even though the BarID is a number, it is written to Excel as text. This is to enable searching for a BarID in Excel, using standard XLInputs functionality, without having to worry about Excel number formatting.

In this way, one can record data to Excel like a database. Extensive record sets may be collected.

We hope you enjoy the demonstration. Let us know if you have any questions.

Excel_KeepSingleInstance is an Excel Add-In that can be used with any other applications for Excel.

Excel_KeepSingleInstance helps prevent the Excel application from opening multiple instances of itself. Often times when users click on a workbook they do not intend to open a secondary instance of Excel, but it can happen. And this can cause problems with DLLs that interface with Excel.

Excel_KeepSingleInstance does not prevent you from opening multiple instances though. You can open multiple instances of Excel if you specifically do so, by re-launching the Excel executable. And in such cases, if you are not using the XLInputs solution, you will likely have trouble with DLLs that commonly interface with a single Excel instance only.

XLInputs has the advantage of interfacing with multiple instances of Excel. More importantly, it has the advantage of efficiently interfacing with cells relative to indentifying text in your spreadsheets. XLInputs comes with over a 100 functions, and avoids cumbersome EasyLanguage and PowerLanguage code configurations such as to initialize Excel workbooks. By design, XLInputs functions can be used directly in input lines of TradeStation and MultiCharts studies and strategies.

Click the link below for a short Flash video that demonstrates how to install XLInputs.

Installing XLInputs_MC_2010

The demonstration covers the following (specifically for XLInputs with MultiCharts and Excel 2007 & 2010):
1) Installing the downloaded MSI file
2) Using the installed desktop shortcut
3) Opening the demo Excel workspace and testing with the test executable: Test-ComClass.exe
4) Requesting XLInputs activation

Let us know if you have any questions.

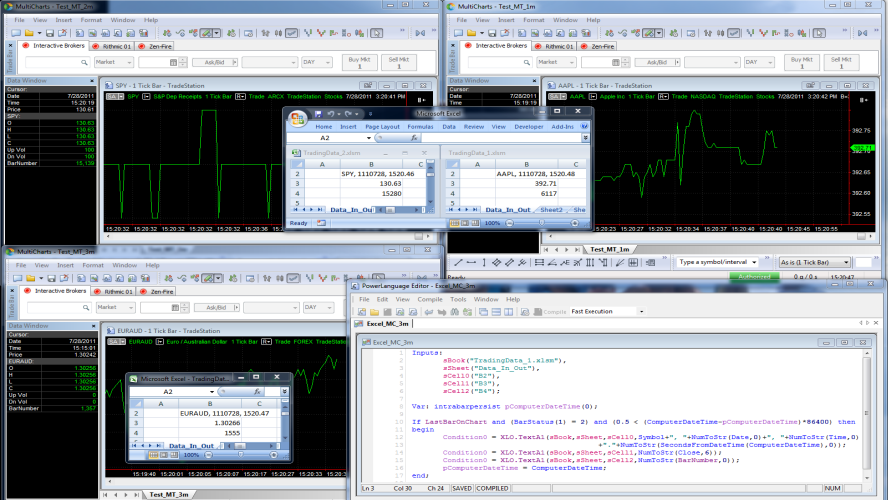
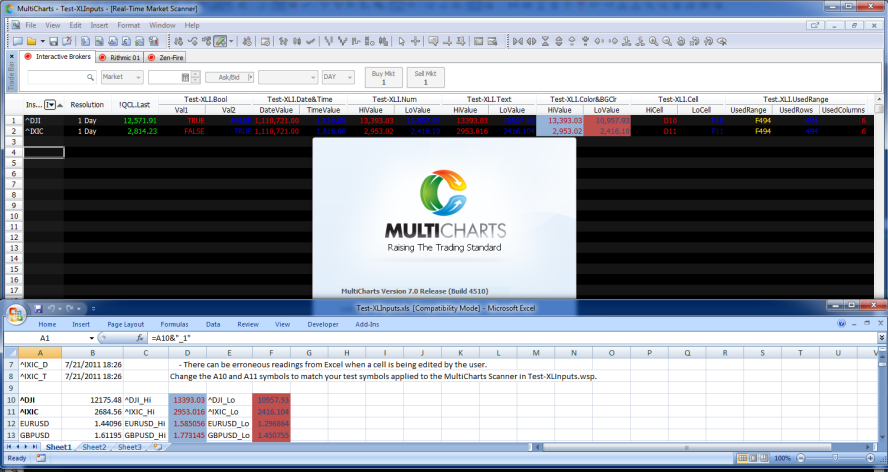
Click on the picture below to see XLInputs working with MultiCharts. The video was made for a customer requesting support.

Customer question:
“Does XLInput work under multi-threaded programs like MultiCharts V7?”

Answer:
Yes, the XLInputs application is thread safe. It has been tested in MultiCharts 5, MultiCharts 6 and the latest MultiCharts 7 release.

7-21-2011-6-26-35-PM
Click on the image for video: XLInputs with two MultiCharts 7 instances interacting with multiple instances of Excel

The product is available for MultiCharts, here: XLInputs for MultiCharts with Excel, where Office 11 PIA is available (installed by Excel 2003)
Or here: XLInputs for MultiCharts with Excel, where Office 12 PIA is available (installed by Excel 2007 & 2010)
See XLInputs System Requirements for more information.

Windows operating system, XP or later
TradeStation 8.7 (Build 3085) or later
or MultiCharts 5.5 (Build 2723) or later
Microsoft Excel 2003, 2007 or 2010

For the original XLInputs installer, the following is necessary:
– Microsoft Office 11 PIA
– Typically this would have been installed by default with Excel 2003
– If the default or full installation of Excel 2003 has not been installed on the target machine, you may need to install the Office components here: Office 2003 Update: Redistributable Primary Interop Assemblies

For the 2010 XLInputs installer, the following is necessary:
– Microsoft Office 12 PIA
– Typically this would have been installed by default with Excel 2007 or 2010
– If the default or full installation of Excel 2007 or 2010 has not been installed on the target machine, you may need to install the Office components here: 2007 Microsoft Office System Update: Redistributable Primary Interop Assemblies

XLInputs installers should prompt to install the .NET framework if the necessary components are not found on a machine. However, you may need to install or run a repair operation on the .NET framework. Do this by visiting Microsoft here: Install or Repair .NET Framework 4

Note that the following XLInputs installers are available:
XLInputs_2010_setup for TradeStation where Microsoft Office 12 PIA is available (installed with Excel 2007 & 2010)
Now included with XLInputs_2010 is also the original XLInputs installer for TradeStation users preferring the older Office 11 PIA
XLInputs_MC_2010_setup for MultiCharts where Microsoft Office 12 PIA is available (installed with Excel 2007 & 2010)
Now included with XLInputs_MC_2010 is also the original XLInputs installer for MultiCharts users preferring the older Office 11 PIA

To see which version of Microsoft Office Primary Interop Assemblies may be installed on your machine, refer to the following location:
…\Program Files\Common Files\microsoft shared\
for Office11 and/or Office12 folders as seen here:
PIAs_8-5-2011 10-21-34 AM

If you need to install the PIA for Excel 2010, the installer for Excel 2007 above should work. However there is a specific installer for Excel 2010 here:
Microsoft Office 2010: Primary Interop Assemblies Redistributable

SeasonalTrends displays annually repeating trends. The tool further supports detrending and forecasting. Larry Williams popularized the approach. It serves those who understand seasonal trends as an important component of forward price estimates. Overlay chart data with historical average annual price patterns. Forecast future movement based on historical average annual price patterns. Detrend price relative to historical average annual price patterns. Create your own views of seasonal patterns. Analyze multiple symbols in RadarScreen. Leverage the indicator in any TradeStation hosting application.

Now available on the TradeStation Strategy Network: SeasonalTrends

Here are downloadable example workspaces for Strategy Network subscribers:
SeasonalTrends ( Version 2 )_ws1
SeasonalTrends ( Version 2 )_ws1a
SeasonalTrends ( Version 2 )_ws4
SeasonalTrends ( Version 2 )_RS

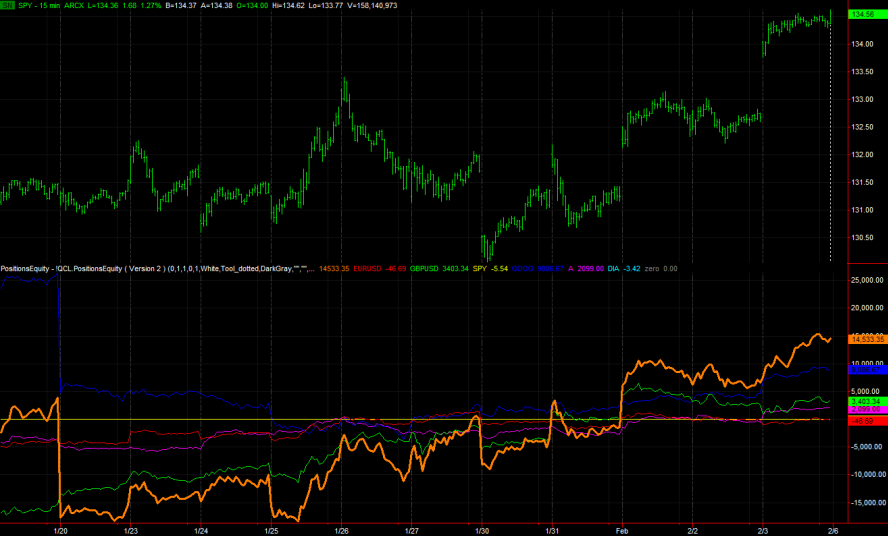
What’s your equity now, minutes ago, days ago, and how has it changed? Go beyond position graph bars and TradeManager records. See the equity of you entire TradeStation portfolio. See the equity of one or more of your current positions. See the change through time and in color, whenever and wherever you want. Professional traders know how their portfolio and positions have been doing and are doing now. Professional traders know their performance and watch their track record closely. Know your wealth as well as the charts of the assets you trade.

Click here or on the image below for a video demonstration.
PositionsEquity_2-3-2012 4-16-44 PM

Available on the TradeStation Strategy Network: PositionsEquity