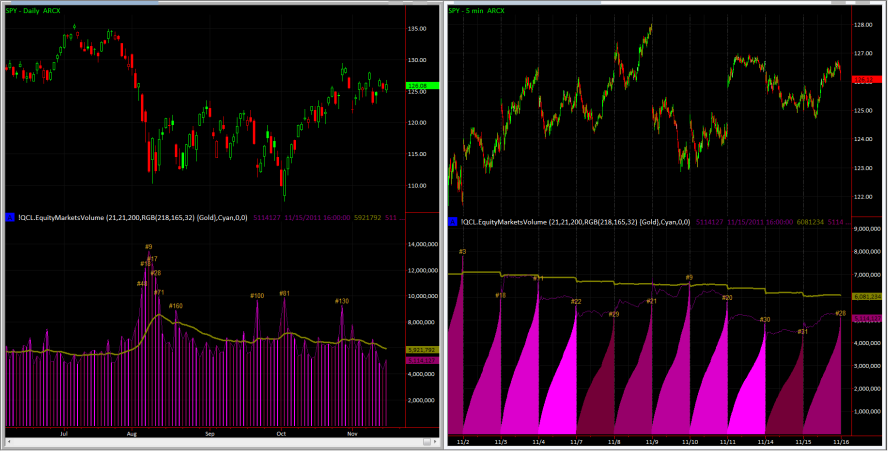
For years we have tracked total volume in US Equity Markets. It has been one of our most useful indicators for quickly ranking the significance of daily trading activity. Too often we hear misrepresentations of daily trading activity on major media outlets. So we figured, why not let traders see the truth for themselves – objectively without hype or spin.
What have been the most active days in US equity markets history? How does today’s activity compare? What total daily trading volume does the current rate of trading project?
In addition to historical records, in real time the EquityMarketsVolume indicator is a powerful forecasting tool. Even after only a few minutes of trading, you get a reliable estimate of what the total trading volume will be for the day, and how the current day compares to history.
EquityMarketsVolume is available on the TradeStation Strategy Network. The demonstration workspace provided with the product is as follows:
Let us know if you have any questions.
