With the EquityMarketsVolume indicator you could have known today’s headlines hours beforehand.
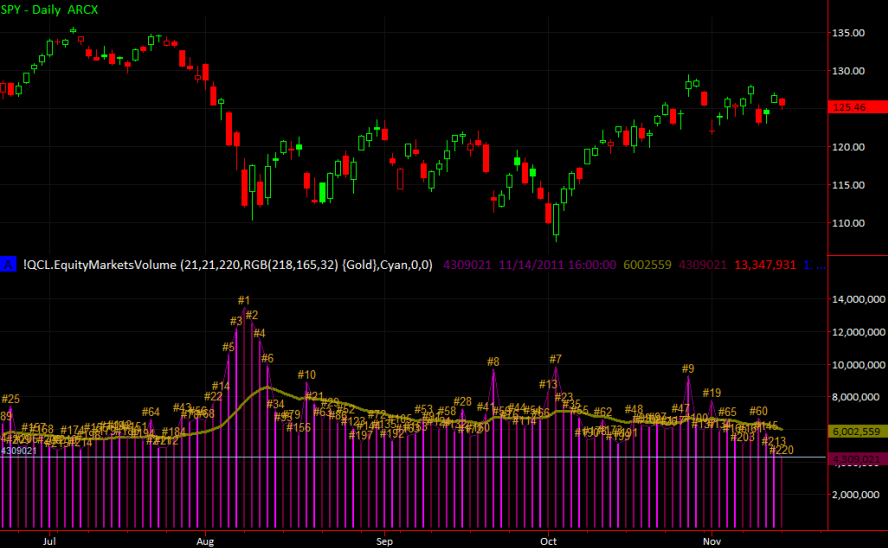
CNBC reported after close that today (November 14th 2011) had the lowest trading volume (for US Equities) this year. They were right as can be seen in the following chart using the EquityMarketsVolume indicator:
Today ranked #220 or 220 trading days this year, with 4.3 billion shares trading hands. Less than the 6.0 billion 21-day moving average. And much less than the #1 all-time trading volume day (October 10, 2008) where 18.8 billion shares changed hands.
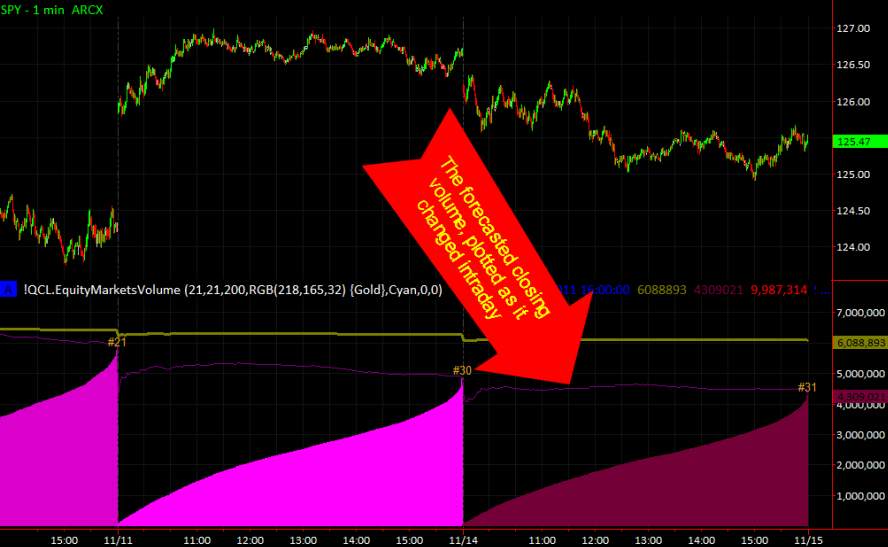
The reason we knew the headline hours beforehand, was due to real-time forecasting by the indicator as can be seen on the intraday plot here:
Note that the #31 rank in the second plot is for a 31-day period. The forecasted 4.3 billion shares range was established by 9:50 AM ET. This was less than the previous 2011 low of 4.5 billion traded on April 25th.
So for all the times we’ve heard trading volume figures abused, today CNBC got it right.
As to trading implications. With a pennant formation in SnP prices, around long-term support-resistance levels, declining volumes just mean that a decision is coming. Buyers and sellers see things very differently. Will the October rally resume?

