!QCL Solutions

Scalable Solutions for Institutional-Level Trading

Professional Algorithmic Auto-Trading of TradeStation Strategies for robust scalable operations with market impact control. TicketManager aggregates and manages all your strategies. It is like having a full-time trading team. Don’t get bogged down with Automation warnings, trying to keep your strategies synchronized. Break free and focus forward, finding opportunities and new strategies that will keep your trading business ahead of the pack.
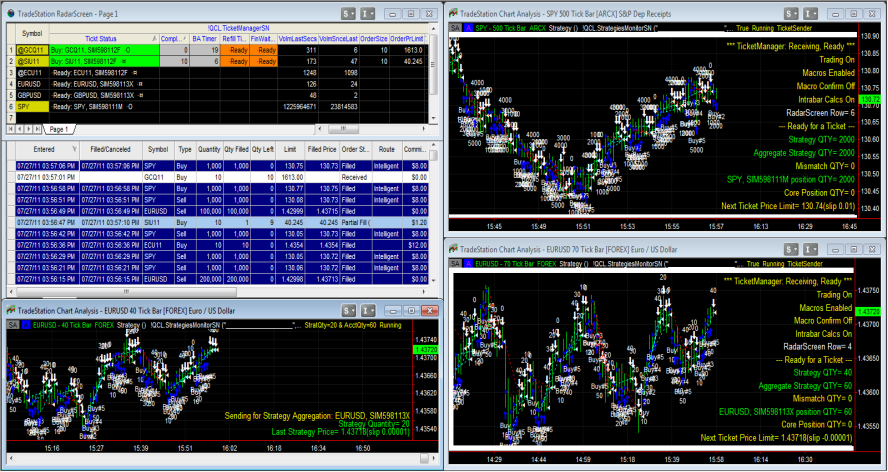
TickerManager on the TradeStation Strategy Network
Click on the image for video: TicketManager for TradeStation 9

Now available on the TradeStation Strategy Network.

Once you have subscribed to the TicketManager product, download the demonstration workspace here:
July 26 2012 Note: The downloadable workspaces are saved in the TradeStation recommended: TradeStation 9.1 Update 10

TicketManager ( Version 27 )

(for use with SIMULATION Accounts)

Here is the same demonstration workspace with a Forex symbol applied, since some customers don’t have Equity data:
TicketManager ( Version 27 ) Forex

And as a subscriber, if you need help setting up TicketManager to trade your TradeStation strategies, contact us at [email protected]. We can get you started with institutional-level execution of your strategies, quickly.

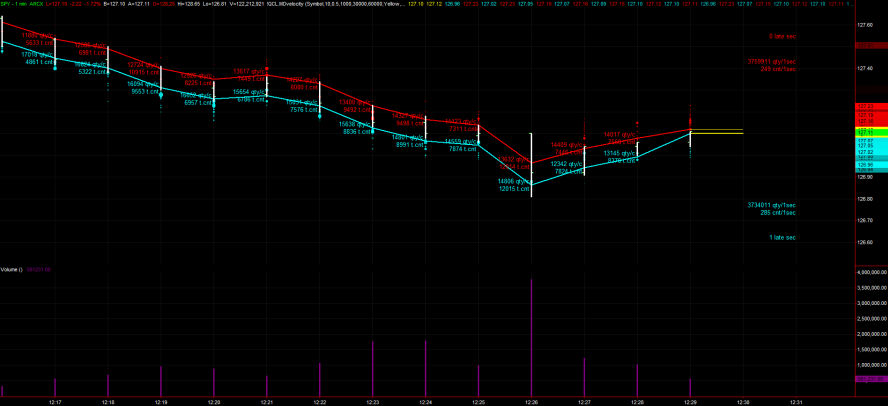
“Trade in the Now with Market Depth Velocity” was a webinar presentation showcased by TradeStation 2011 May 23.

Trade In The Now with Market Depth Velocity

The video part of the PowerPoint presentation above, demonstrating the Market Depth Velocity indicator, is here:

MDV_SPY_6-15-2011 12-28-21 PM

SPY 1-min bars, Wednesday, 2011 June 15. Video through 12:22 PM, Image at 12:28:21 PM ET

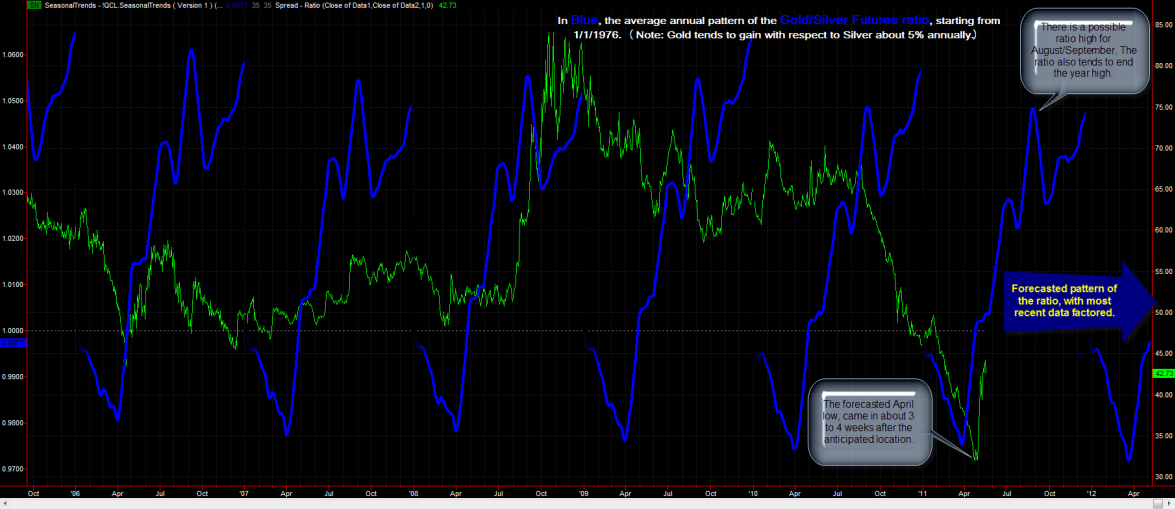
The Green line in the chart below is the daily calculated Gold/Silver ratio (scaled to the right).

Overlaid in Blue is the average annual percentage change of the Gold/Silver ratio (scaled to the left) for front-month futures contracts (GC and SI respectively). The percent change pattern starts January 1st, each year at 1.00. The long-term average pattern for the ratio shows that it tends to rise about 5% annually. So the blue line tends to end each year around 1.05.

Using front-month futures data from paid sources, beyond what is available in TradeStation, we have the Gold/Silver ratio back to 1/1/1976. This data is used in the study. So the long-term average annual percentage change pattern, seen on the left of the chart, represents up to 35 years of information.

SeasonalTrends for the Gold/Silver ratio from 1/1/1976

With !QCL.MyIndex create a custom Index like the Dow Jones Industrial Average, NASDAQ-100 or S&P-100.

The MyIndex indicator makes it simple. Input component symbols, multipliers and base values in comma-separated inputs (a tool is provided to build input strings). Choose from multiple viewing options, set alerts and even write your custom index to a file, which can be used as 3rd-party data. The indicator will automatically load component data to match bars of the data stream on which it is based.

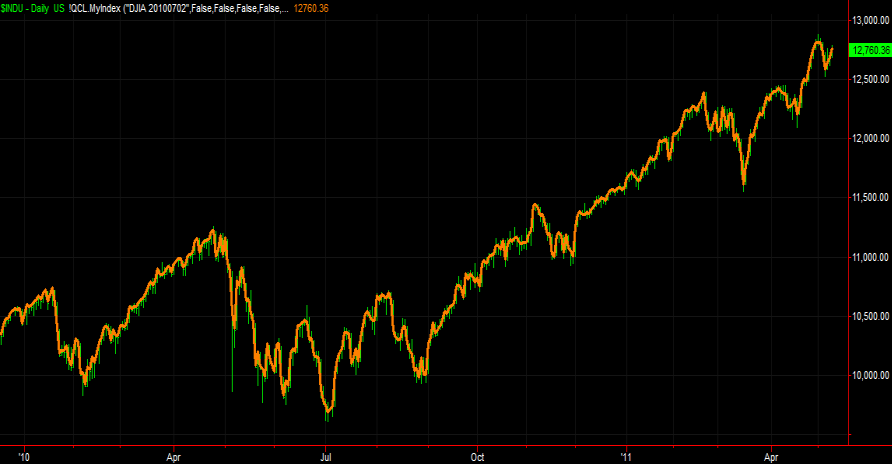
Here is the indicator setup to calculate the Dow Jones Industrial Average:
MyIndex(DJIA)_5-11-2011 8-57-16 AM
Plotted on top of the $INDU symbol.

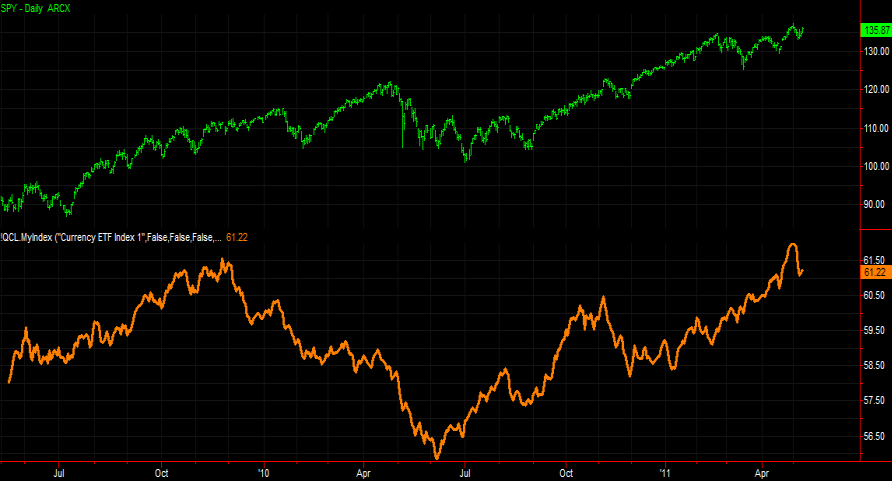
Here it is for a custom indicator of Currency ETFs, plotted in a sub-graph:
MyIndex(CurrencyETFs)_5-11-2011 8-58-41 AM

using the following Symbols:
“ERO,FXA,FXB,FXC,FXE,FXF,FXM,FXS,FXY,GBB,JYN,UDN,UUP”
and multipliers:
“0.000796176,0.034901362,0.006041705,0.044760021,0.201718622,0.024112679,0.001332625,0.002888883,0.045958947,0.000176711,
0.000645934,0.035863872,0.600802463”

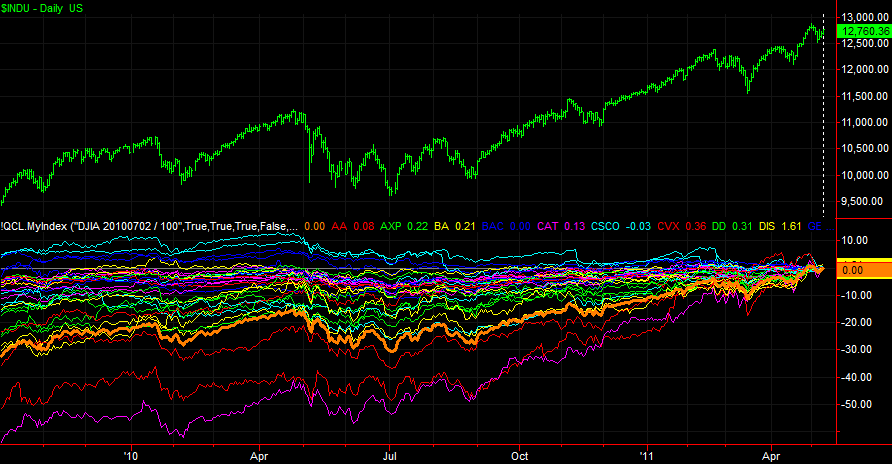
As mentioned, with viewing options, one is to be able to see their index relative to the last bar on the chart as follows:
MyIndex(DJIAcomponents)_5-11-2011 9-25-05 AM
The index value is adjusted to be 0 when it first reaches the last bar on the chart. In the particular configuration illustrated, it is also setup to show values of component data (i.e. the Dow 30) relative to DJIA changes divided by 100.

!QCL Solutions MyIndex indicator is available for TradeStation 9.0, through the Strategy Network.

If you have questions about using the MyIndex indicator, please add a comment to this post.

There have been TradeStation data and order execution APIs that were never released. So currently, TradeStation does not provide APIs like Sterling Trader, Interactive Brokers and several other brokers.

For now, as a workaround, one can interface with OOEL code running in a host window. This requires that TradeStation is open with a chart or grid running a custom analysis technique. Then a DLL can interfaces with the analysis technique to complete a homegrown API. This solution can be a good one, but the extra steps of needing a chart and special analysis technique are considered too cumbersome for many.

A workaround that we have used for years involves issuing orders like the Iceberg application and getting feedback on those orders like the RealtimeRecords application (see link). Both sending orders and receiving of feedback is done through our TSorders.dll (not advertised or sold on our site). It is similar to the TSPlatAuto.dll.

An important point is that the only programmatic trading that TradeStation officially supports is through EasyLanguage and order-entry macros in the platform. Thus with other approaches, there may be little to no recourse with TradeStation if something fails like an order not being sent or feedback not being received.

With that in mind, if one of the API approaches explained above is of interest, let us know.

Here’s a new indicator for TradeStation 9.0 users. We have had this indicator for quite a while, since well before the new functionality in TradeStation was even known. So the product is a mature one. We have put much time into making it extremely useful to active traders as well as computationally efficient and robust.

The videos below demonstrate how the indicator works. Recordings were made after hours so that they are easier to evaluate. We plan to make the indicator available for lease in a few weeks. Let us know what you think.

Videos:

MARKET DEPTH LEVEL X_2011-02-16_1734

MARKET DEPTH LEVEL X_2011-02-16_1740

MARKET DEPTH LEVEL X_2011-02-16_1744

MARKET DEPTH LEVEL X_2011-02-16_1749

MARKET DEPTH LEVEL X_2011-02-16_1800

MARKET DEPTH LEVEL X_2011-02-16_1810

MARKET DEPTH LEVEL X_2011-02-16_1839

MARKET DEPTH LEVEL X_2011-03-21_1055

Custom Option trading solutions that reference the multiple data streams of an option chain can be developed, given the standardization in option symbology. !QCL Solutions has put together custom and robust automated options trading systems that auto-locate options based on the underlying symbol, date and price. If you choose to attempt this on you own, be aware that such development efforts can be quite involved and error prone.

Currently TradeStation 9.0 Object Oriented EasyLanguage does not support programmatic access to option chain data. For more information, refer to a statement from TradeStation here: https://www.tradestation.com/Discussions/Topic.aspx?Topic_ID=106504#542586, stating that “EasyLanguage does not have access to the option chain of a given underlying symbol.” Following the statement, there is a link to an enhancement suggestion poll that may be of interest.

Addendum:
Since the posting above we have released OptionsX on the TradeStation Strategy Network. With it you have programmatic access to option chain data. OptionsX comes with over 40 tools for options trading and analyses relative to underlying symbols from TradeStation Charts, RadarScreen and other hosting windows.

You can quickly change chart intervals with TradeStation macros which can by typed, associated with hot keys or associated with toolbar buttons. For example, one could have a toolbar like the following: 

Example Custom Toolbar


You cannot add to the following drop-down, in the latest TradeStation 9.0 (Update 8521) platform:

Intervals Drop-Down

For the ability to customize the Interval drop-down list, shown at the top, you may want to request such a feature here: https://www.tradestation.com/Discussions/Forum.aspx?Forum_ID=215&selCategory=0

We often receive requests to fix EasyLanguage code developed for a customer by another EasyLanguage Specialist. Such projects raise issues like the following:

  1. The customer may be sharing code, owned by another party, that was intended to be confidential.
  2. The other developer may have been denied proper compensation. We do not wish to become involved in any related disputes or become the next developers to be stiffed.
  3. Developing original code, rather than modifying other code, is more cost efficient and straightforward to support.

If however a customer is searching for the right relationship, we are happy to help. In the business of systematic trading, there are costs of doing business which involve system development, system enhancements and ongoing maintenance. The development costs do not have to be exorbitant, but should be understood as ongoing. Otherwise, the likelihood of trading success is low. We at !QCL Solutions want your success.

There is a common complaint that developers don’t have “skin in the game”. Thus they provide the bare minimum and demand immediate payment. That has been a consistent theme. I have yet to hear of a specialist where the customer did not complain that they were hassled for payments. Trust me, we have been on both sides and understand customer and developer points of view.

At !QCL Solutions we want the right relationship. We avoid situations where a collections process may be necessary. That is why we are upfront with our retainer charge. We want clients, primarily institutional, who understand the value we bring, are committed to an ongoing business relationship and are capable of capitalizing on the services provided.

As an EasyLanguage Engineer at TradeStation and as a Specialist now, I have had frequent requests to capture and test the plotted signals of EasyLanguage Indicators that clients purchase from other 3rd parties.

Ultimately in the coding world, the question is not can we, but is it worth the effort. TradeStation does not yet expose values of other indicators through a class structure, as with the AccountsProvider and PriceSeriesProvider components in the 9.0 platform. So determining plot values of a protected indicator would be very difficult, unless the indicator writes those values to accessible memory, to files or exposes the values through alerts.

The best way to gain access to indicator values would be for the 3rd-party developer to provide them through an EasyLanguage function. Then the indicator outputs could be used by the client however they like, in their own custom indicator or strategy. In a strategy they could back-test for effectiveness in historical trade simulations.

Unfortunately 3rd-party providers of trading indicators rarely if ever provide the signals through functions, or in strategies. Generally they sell an indicator and an education on using it. But before moving forward with any 3rd-party “tradable” indications, if there is no function or strategy with which you can test the signals you should ask yourself why.

A 3rd party may rightly say that their indicator is for real time only, is multi-asset, or is otherwise a system that cannot be well back-tested with an EasyLanguage strategy. Whatever is said, there is always a way, even if it is only by forward-testing. And if the 3rd-party cannot provide audited results that at minimum FINRA would approve, be very careful.

I have seen countless systems where they show pretty pictures and neat software. They promise that numerous PhDs and supercomputers have been put to task. They have Wall Street professionals on staff, etc. All of that is meaningless and is actually greater evidence of a confidence scheme, than of a truly professional trading system. If they can’t support performance projections or give you a way to test their system independently, stay away!