!QCL Solutions

Scalable Solutions for Institutional-Level Trading

Answer: Monitor your trading accounts and orders.

Any mechanical system of trading with TradeStation depends on TradeStation interfaces, TradeStation data, TradeStation connectivity, User inputs, the Operating System (and often the System Time), potentially other applications like Excel, etc. For numerous reasons, it is always possible that orders could be placed, cancelled or unplaced in unintended ways.
 
There are several posts on TradeStation forums about the need to monitor strategies. Here is one example: https://www.tradestation.com/Discussions/Topic_Archive.aspx?Topic_ID=43614
 
The example is about an automation setting for stop orders. There is similar language used throughout TradeStation forums for various forms of automation. No form of automation with TradeStation circumvents the need to monitor trading accounts and orders.
 
So always have a plan to monitor your trading systems. One way to improve monitoring of your TradeStation Systems is with the RealtimeRecords Add-On, which can record, email and pass your trading information to custom applications. With a well thought-out plan, good systems can perform to their potential.
XLInputs can replace the free ELExcel.dll in the TradeStation forums, but the free dll does not replace XLInputs. XLInputs was designed to make working with Excel from EasyLanguage, very easy. Without any special code in your EasyLanguage indicator or strategy, using an XLI function, EasyLanguage can reference inputs in Excel even if you don’t know the exact row or column.

With the free dll, you would need header lines in your code. Then your custom code would need to loop through cells in an open workbook to find an identifier that locates your specific input. This is extremely process intensive since the most expensive operation when interacting with Excel is to read from it. (Writing is faster.)

XLInputs streamlines such processes by taking advantage of Excel functionality. It has Excel perform the search; making what would otherwise be a CPU intensive process, light and efficient. And the language to accomplish this in an EasyLanguage input is as simple as the following numeric example: XLI.Num(“Book1”, “Sheet1”, “Identifier”, 0). Note that 0 is a default return value if the identifier is not found in Excel.

Further XLInputs is not limited to reading from Excel. It writes to Excel with ease. It can:

  • read and write comments
  • get and set font colors
  • get and set background colors
  • read and write times, converting to EL format when reading any Excel date or time value
  • read and write dates, converting to EL format when reading any Excel date or time value
  • read and write text
  • read and write True/False values
  • identify the location of specific cells returning row, column and A1-address information
  • determine the used range
  • clear cell formats, delete comments, etc.

And there are many custom application of the technology like placing a list of dates and times in Excel; using that as a list of valid trading session times to be honored by Strategies. It can be leveraged for custom optimizations, other tuning processes, and many other operations imminently useful to serious traders.

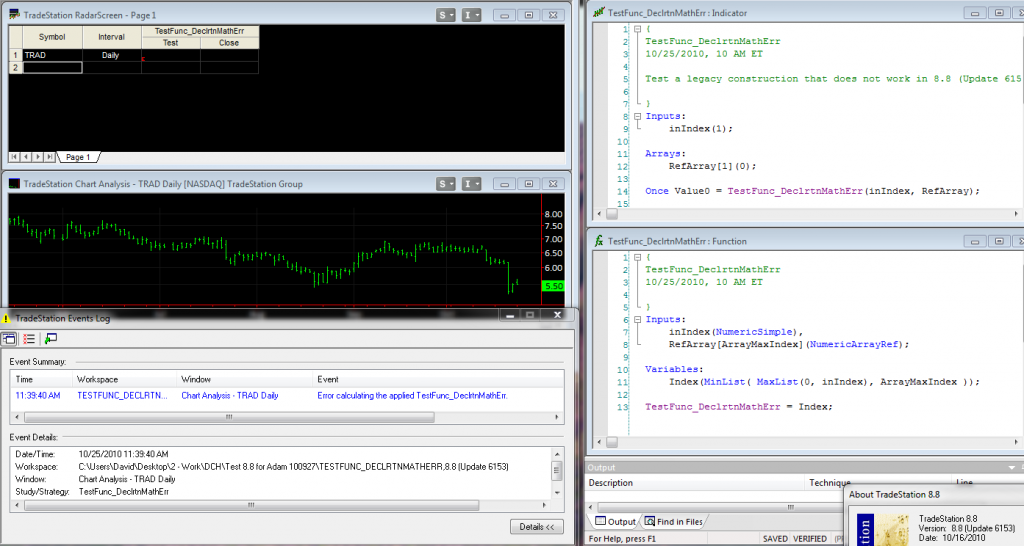
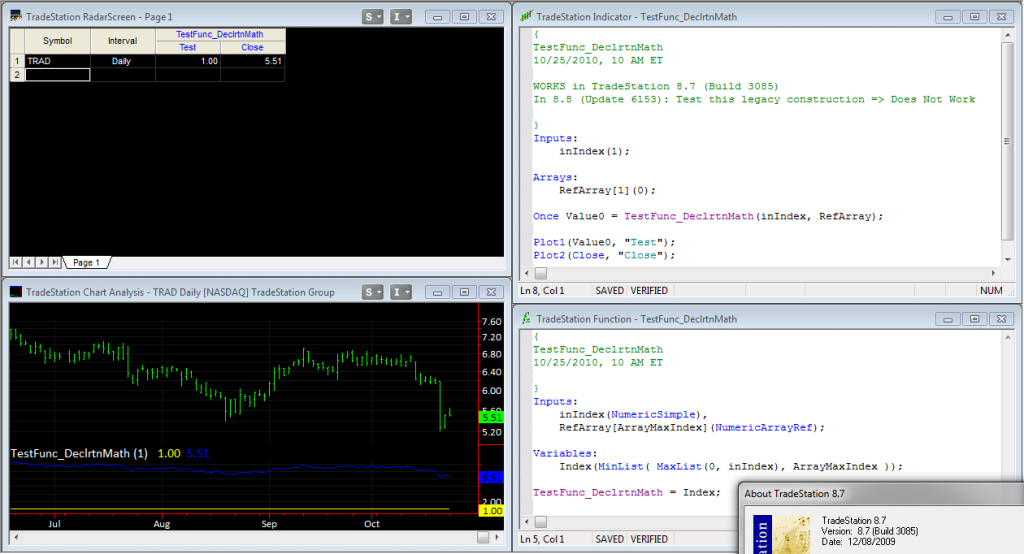
TradeStation will likely resolve this and other legacy code issues, in time. Until then, be aware that there are some issues with legacy EasyLanguage code not working in TradeStation 8.8. Here’s an example function that uses math in a variable declaration, working in 8.7 but not in 8.8:

TestFunc_DeclrtnMath, Works in 8.7

TestFunc_DeclrtnMathErr, Does Not Work in 8.8

The essence of the issue is not that math was performed in a function variable declaration. The issue is that it refers to the MaxIndex value of the Reference Array. This worked in 8.7 and earlier versions of TradeStation, but no longer works in TradeStation 8.8 or later builds.

The reason that the math is shown is that a customer had his own code with over 6000 lines and multiple levels of functions. Without improved debugging facilities or compiler error messages, finding such issues can be a significant effort. Fortunately I found this one relatively fast. The point is that the user calls a function once, and when called, he needs values in the reference array, up to an input index value. So in the initialization, there is a check to be sure that the input value is valid and does not exceed the MaxIndex value of the array.

This is fixed by setting the variable’s initial value outside of the declaration, using the Once statement if necessary. However I mention this out of concern for others who may have this issue, and for possibly similar issues with legacy code not working in 8.8. There can be significant needs for code maintenance as one moves forward to 8.8 and beyond.

See the TradeStation Forum Post reporting the Bug.

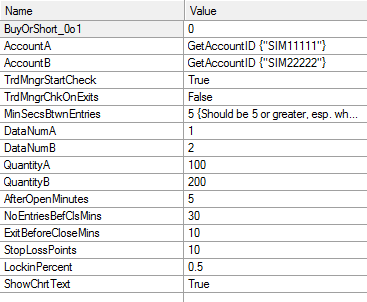
Inputs for demo, click to see video:

FAS & FAZ test inputs

Here’s an example Equity-Curve Trading system, using an EasyLanguage Strategy for simulation and Order macros to keep an Account synchronized, while limiting slippage.

For starters, if you saved a TradeStation workspace with RunCommand enabled, you will be prompted on reopening:
Open with Strategies & Macros Enabled

Overview:
Example Equity-Curve System Explained

Synchronizing:
TSO.StratMatch Synchronizing

Synchronization Halt:
TSO.StratMatch Synchronization Halt

TSO.StratMatch function:
TSO.StratMatch Function

TSO.StratMatch function display
TSO.StratMatch Display

TSO.StratMatch function inputs
TSO.StratMatch Inputs

Example Strategy inputs:
Example Strategy Inputs

Enable RunCommand and Macros to Trade:
Enable RunCommand & Macros

Work with an Initial Mismatch and Start Equity-Curve Trading:
TSO.StratMatch Initial Mismatch & Trading

Here is a video demonstrating how TradeStation macros, accessible to EasyLanguage through RunCommand, can be used to create a custom complex order for Limit to Market conversion at a specified time.

TSO.Lmt2MktCustom function

If your Trading System is a Strategy, then put it on the Strategy Network, available in TradeStation 8.8. The Strategy Network distributes only binary files and restricts use by account and monthly lease periods. Code there is secure.

If you are a C++ programmer, write your code in a C++ dll referencing TSKit.dll for access to data (through the EL code using your dll). Then entitle your dll for specific user accounts.

For those wanting to use .Net dlls, employ a healthy level of obfuscation.

Otherwise, your EasyLanguage code can be hacked and intellectual property lost.

Let me know if you need assistance.

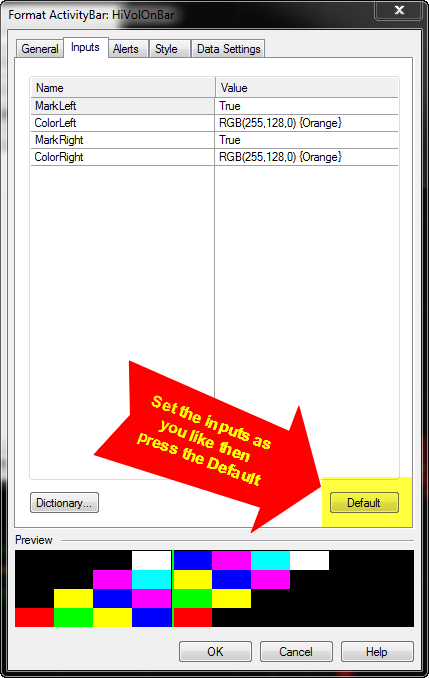
In adding an ActivityBar study to multiple charts, you may want to setup default inputs as shown here:

ActivityBar Inputs, default

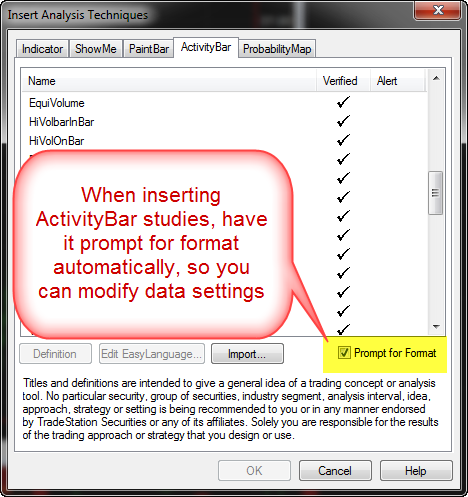
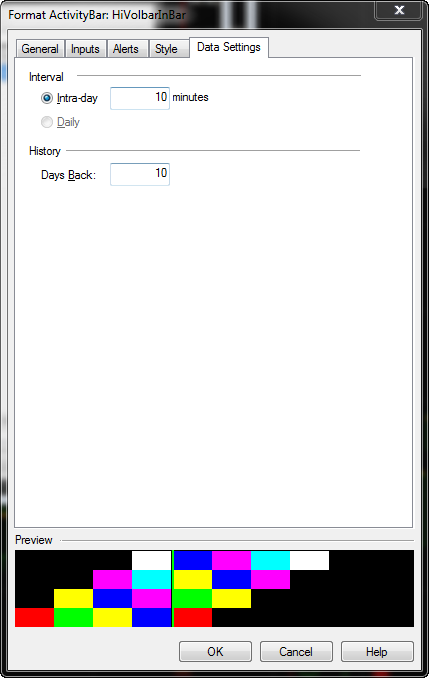
And upon insertion of an ActivityBar study, you may want to adjust the Activity Data interval and length of historical look back. To do this quickly, in the Insert Analysis Technique window, ActivityBar tab, set as default to “Prompt for Format”.

ActivityBar Prompt for Format, default

Then upon insertion of any ActivityBar Study, you will be prompted to adjust the format. There select the Data Settings tab, if it didn’t already pop up as the last tab used. Set the interval and history request as shown here:

ActivityBar Data Settings

Note, a command line shortcut to launch the ActivityBar study shown, is as follows:

.iat HiVolOnBar

The command line instructions can be setup as a toolbar button or shortcut key.

Even though enhancements are occasionally made, the core technology of EasyLanguage Strategies, is old.

Development reasons aside, will there be core-level improvements? In a future release of TradeStation, there may be Strategy Objects and Events (not to be confused with Order Objects). But realistically, the chances of such new features, done well and in the near term, are slim.

There are many ways to work around legacy issues. Best paths depend on the situation, which is why it is advisable to speak with an experienced EasyLanguage Specialist.

In general, I find it advantageous to avoid EasyLanguage that is exclusive to a Strategy context, mostly trading from indicators. The downsides are a loss of Strategy Performance Reports, convenient Strategy Keywords and Strategy Automation. Upsides include the ability to:

  • Functionalize strategy logic to build scalable approaches, available to numerous Strategies and Indicators
  • Customize back-testing assumptions, and how strategy performances are estimated
  • Trade from a Chart or Grid application, like RadarScreen, where it is more realistic to manage trading in multiple symbols

On the latter point of automated trading, currently without an EasyLanguage Strategy, that is accomplished with EasyLanguage access to command line macros. In a future release of TradeStation, automated trading can be accomplished with Order Objects.

In real time, TradeStation studies can process data tick-by-tick as bars form. That way one can do things like determine the price at which there was the highest burst of trading volume or the price for which most trading occurred throughout the time of the bar.

Historically, intrabar details are more limited for TradeStation studies. The way to do it is with ActivityBar studies.

Other ways to look inside bars historically include:

  1. Intrabar order generation for Strategies (by default looks at bars in 4 steps)
  2. Look-inside-bar back-testing for Strategies, which can be set with resolution as fine as tick-by-tick (currently with volume keyword limitations and no more than 6-months of history).
  3. Add secondary data streams to a chart, to be the inside-bar data for the data stream of interest. Note that multi-data charts are not currently allowed to have a tick data stream. This is the same as with ActivityData which must be of timed-interval bars.

So far, Strategies can’t plot. Displaying information gathered by approaches 1 and 2 is more involved than with indicators. And all three of the alternative approaches require extra setup work from the end-user; so the above approaches should only be considered for special cases.

ActivityBar studies are the way to go. The one caveat is that ActivityBar EasyLanguage can be tricky.

Here are two example ActivityBar studies:

  1. HiVolbarInBar – Shows the highest volume (ActivityData) bar inside the visible Bar.
  2. HiVolOnBar – Uses ActivityData to estimate the price of highest trading volume within a Bar.