!QCL Solutions

Scalable Solutions for Institutional-Level Trading

Browsing Posts published by admin

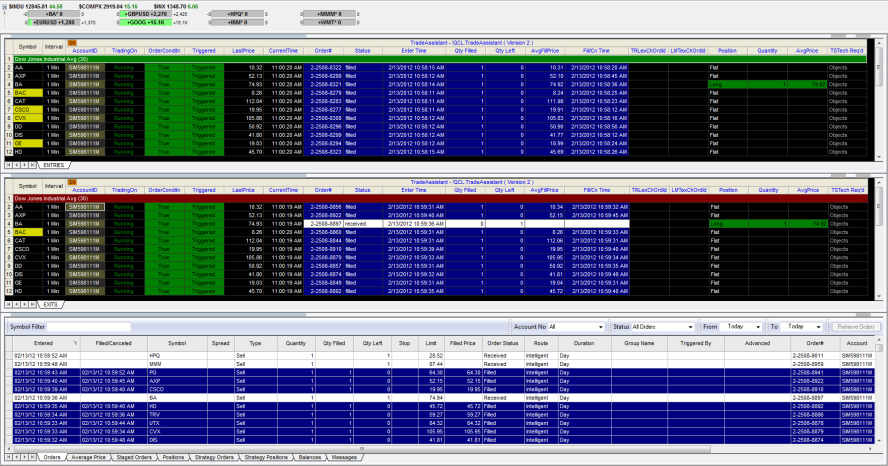
TradeAssistant is designed to be a fast and flexible order placement tool. Use it in RadarScreen with 100’s of symbol and custom triggers for each. Put orders in OCO groups to leverage buying power. Create OSO relationships and brackets. Check the status of orders and positions at a glance. TradeAssistant can be used in charts to quickly set multi-symbol order triggers. TradeAssistant is automation for the discretionary trader.

TradeAssistant Pro features the WATS application to access and automatically trade advisor signals. If you are using TradeAssistant Pro, try this demonstration signal file (for simulated accounts) with the WATS_Docker indicator, found in the default “Launch” workspace:
TradeAssistant WATS TradingApp demo file
Login here for your WATS files:WATS

Note that WATS_Docker is the same application as the WATS TradingApp, but hosted in a Chart as an indicator. For placing potentially large lists of interrelated orders, as with the WATS application, Chart and RadarScreen windows offer the best environments. The TradingApp window environment is to be improved in a coming release of TradeStation (expected to be in 9.5). Until then, use WATS_Docker for trading.


For both TradeAssistant and TradeAssistant Pro, here are two videos demonstrations of placing large lists of orders with the original !QCL.TradeAssistant indicator in RadarScreen:

Video demonstration, TradeAssistant ( Version 1 )

Video demonstration, TradeAssistant ( Version 2 )
Sign up for TradeAssistant on the TradeStation Strategy Network
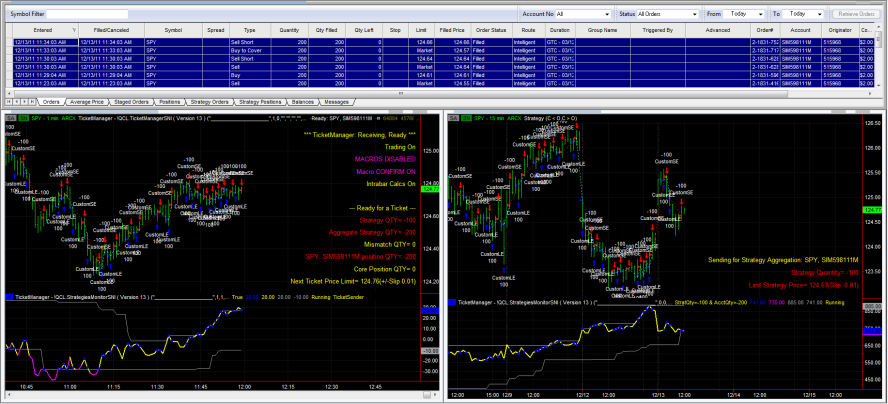
TicketManager is available on the TradeStation Strategy Network to replace traditional strategy automation. It improves on traditional strategy automation which is prone to derail and lacks algorithmic methods of controlling market impact. Traditional strategy automation also lacks a way for you to automate multiple charts for the same equity symbol. TicketManager solves this by aggregating multiple charts, by symbol and account, for a target position and price creating tickets which are algorithmically processed.
TicketManager was designed to ideally run in a RadarScreen window. This provides you with one window where algorithmic trading of multiple symbols can be easily monitored and managed. However, TradeStation does charge for RadarScreen, so not every customer has it. For such customers, TicketManager can run in a chart to automate trades of the chart symbol where it is applied.

Here is a demo workspace for TicketManager subscribers:TicketManager ( Version 15 )_wChartOnly

Click on the image below to see a video demonstration of TicketManager with charts only.

Some TradeStation customers had experienced issues running our TicketManager application through the Strategy Network. The TradeStation Quality Assurance department was not able to replicate the issues, so having them addressed was a challenge. It has also been a very stable application in our trading for over a year. It has performed well for our key institutional customers. But we were able to replicate the issues and have now addressed them in the latest release, with elegant solutions that both work around 9.0 problems and improve processing efficiency.

In addition to the enhancements, look forward to TradeStation 9.0 updates and the new TradeStation 9.1 release.

So if you need robust scalable institutional-level trade automation at TradeStation, we hope you try TicketManager here: TicketManager on the Strategy Network

For help with your TicketManager workspaces and settings, contact us at [email protected]

See yesterday’s post: Equity Market Volume has remained low

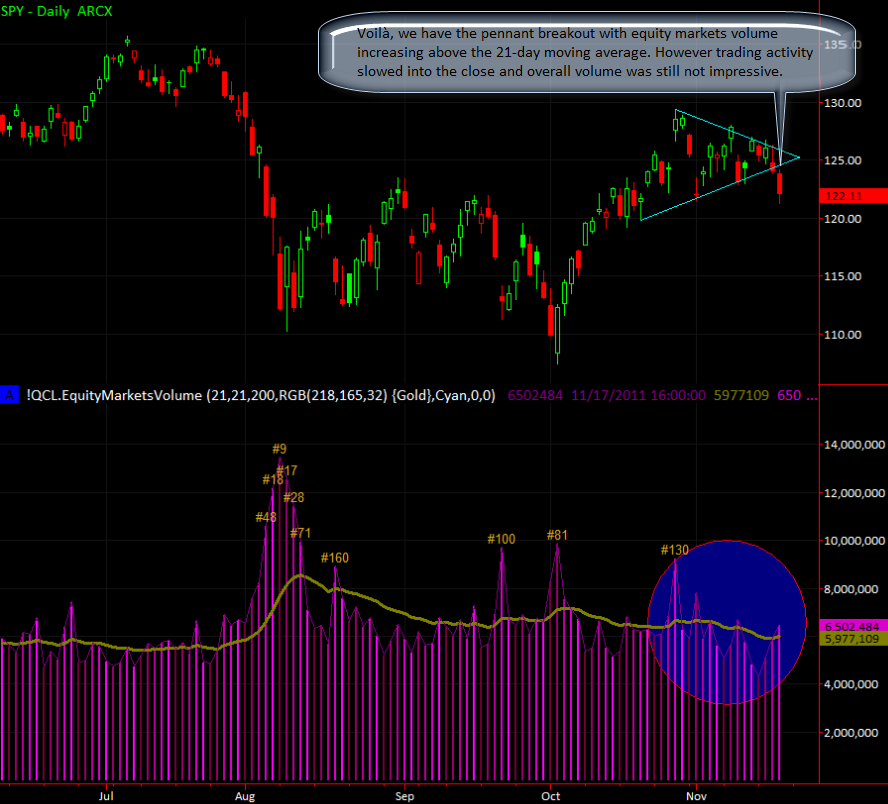
Voilà, we have the pennant breakout with equity markets volume increasing above the 21-day moving average. However trading activity slowed into the close and overall volume was still unimpressive.

EquityMarketsVolume

The above chart was produced with the default workspace of the EquityMarketsVolume indicator available on the TradeStation Strategy Network.

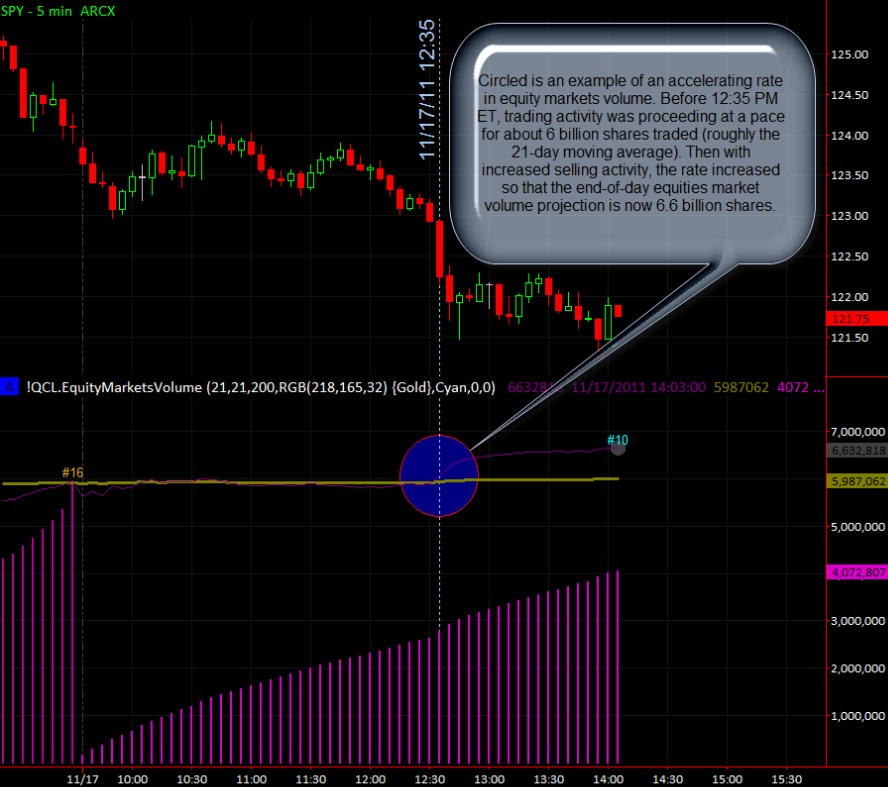
In the image below, circled is an example of an accelerating rate in equity markets volume. Before 12:35 PM ET, trading activity was proceeding at a pace for about 6 billion shares traded (roughly the 21-day moving average). Then with increased selling activity, the rate increased so that the end-of-day equity markets volume projection is now 6.6 billion shares.

EquityMarketsVolume - Accelerating Rate

Note that the #10 ranking is for the last 31 trading days. It is the first day in over a week to trade at a rate above the 21-day moving average, but this is still a relatively slow pace of trading.

The above chart was produced with the default workspace of the EquityMarketsVolume indicator available on the TradeStation Strategy Network.

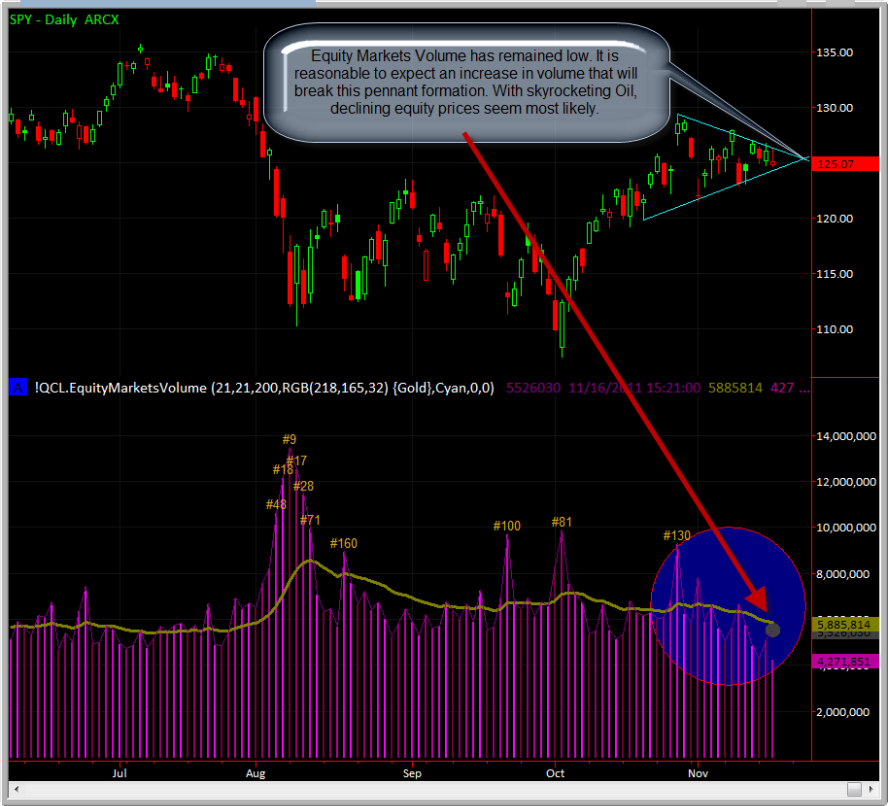
It is reasonable to expect an increase in volume that will break the pennant formation seen in the chart below.

Equity Markets Volume has remained low

With skyrocketing Oil prices, declining equity prices appear likely in the event of trading volume increases.

The above chart was produced with the default workspace of the EquityMarketsVolume indicator available on the TradeStation Strategy Network.

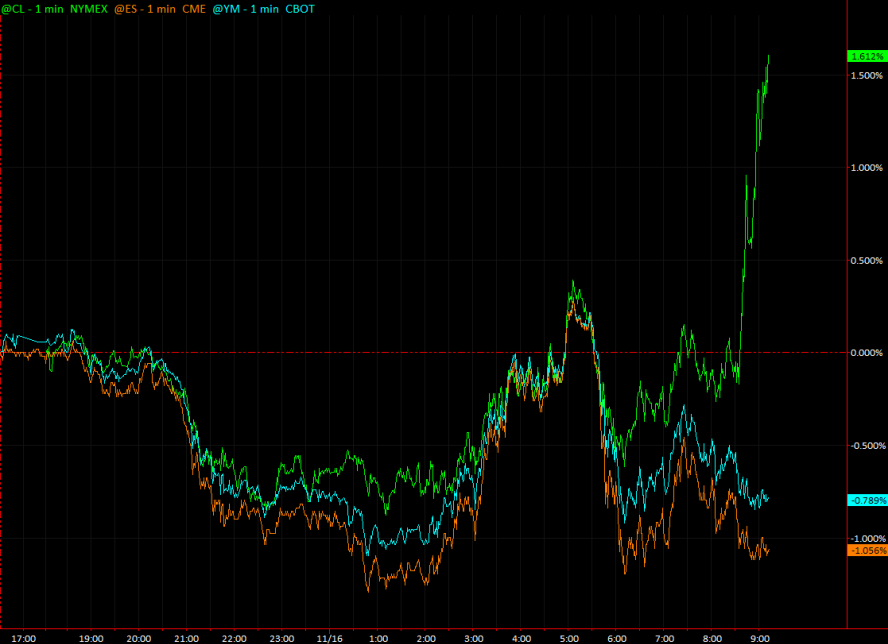
The talk on the news is that futures are down and Oil spikes over 100. Here are the relative changes in futures since yesterday’s close:

Overnight Futures changes in perspective

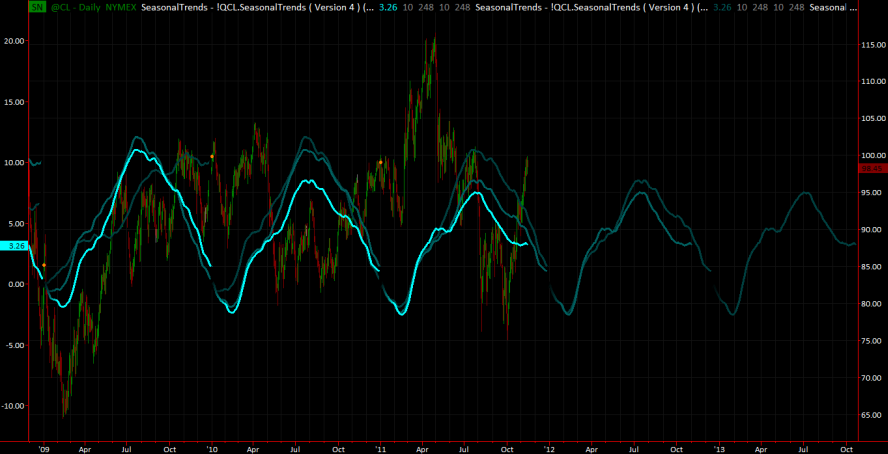
See the previous post about SeasonalTrends for the Oil contract, CL. The rapid increase is counter to seasonal trends, and is hitting a strong resistance level at the end of a rapid price increase beginning October 4th.

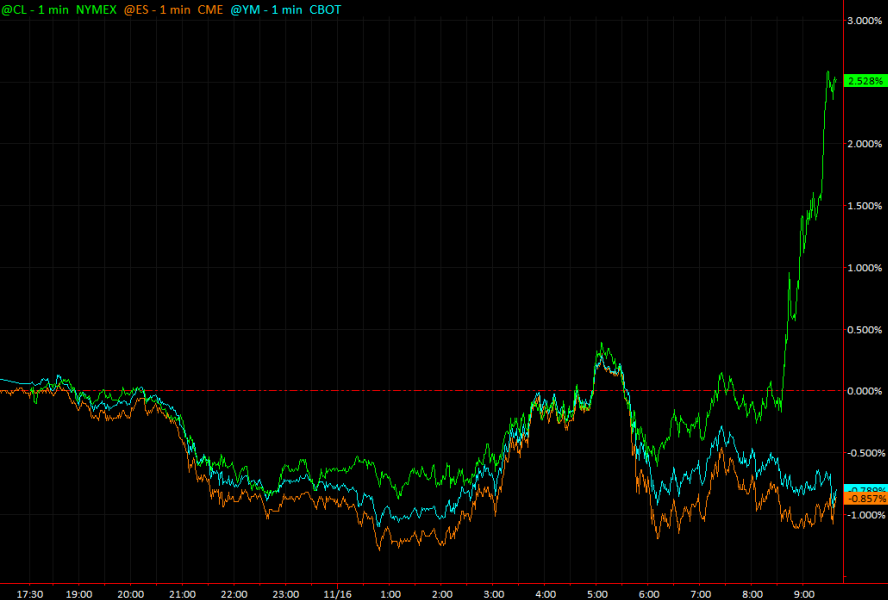
Oil has generally been moving up with the equity markets as the dollar decreased. Now it is making an aggressive move up, counter to both a gap down in equities, a move up in the dollar, and against seasonal trends.

… Wow, and here is how the extreme change accelerated through the Equity Markets open

Overnight Futures changes into Equities open

Look to the inventory report today. Should be interesting.

Below are SeasonalTrends patterns for the continuous Light, Sweet Crude Oil Futures (NYMEX) CL contract using the maximum available daily data at TradeStation.

If you are a subscriber to SeasonalTrends on the TradeStation Strategy Network, click on the image to download the workspace.

SeasonalTrends_CL_2011-11-15

!QCL.MyIndex and the MyIndex products were originally the same. We were deciding what name to use and kept both.

Now there is a difference. We have released an extended version of the MyIndex product under the !QCL.MyIndex listing on the TradeStation Strategy Network.

In addition to being able to form custom indices like the Dow Jones Industrial Average, more involved calculations are possible based on the following formula:

Component = ((Symbol Close) ^ Power) * Multiplier + BaseValue

Components Combined = Component1 {operator1: +,-,*,/} Component2 {operator2} Component3 …

Composite = ((Components Combined) ^ CompositePower)) * CompositeMultiplier + CompositeBaseValue

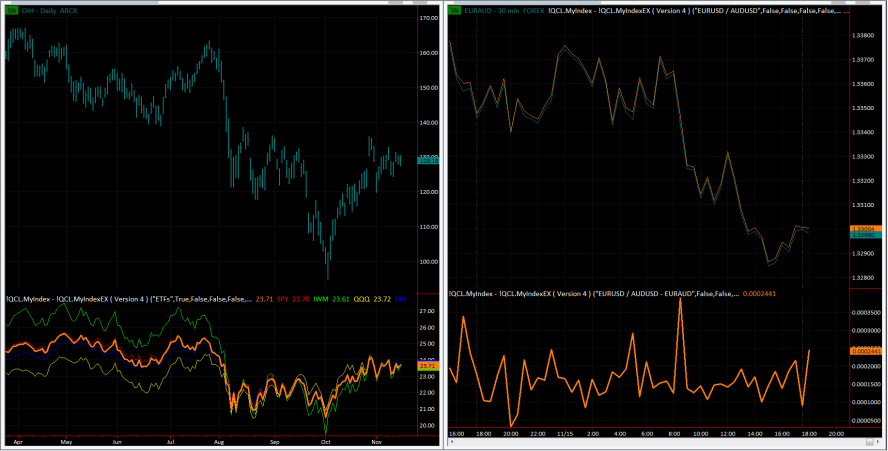
You can still have custom indices like before, as seen in the left chart below. You can now also do more.

An interesting and simple use of the system is to put together custom currency pairs. In the demonstration workspace provided with version 4, the second of two charts (on the right) shows the EURAUD as created by a custom index based on EURUSD and AUDUSD. The values are compared and differences calculated by subtracting EURAUD prices. The slight differences are due to currency pair spreads. This information could be useful, as could be numerous other application of the new !QCL.MyIndex indicator.

If you are subscribed to the !QCL.MyIndex Strategy Network product, then you can download and run the demonstration workspace by clicking on the image below:

!QCL.MyIndex ( Version 4 ) demonstration workspace

Let us know if you have any questions.

With the EquityMarketsVolume indicator you could have known today’s headlines hours beforehand.

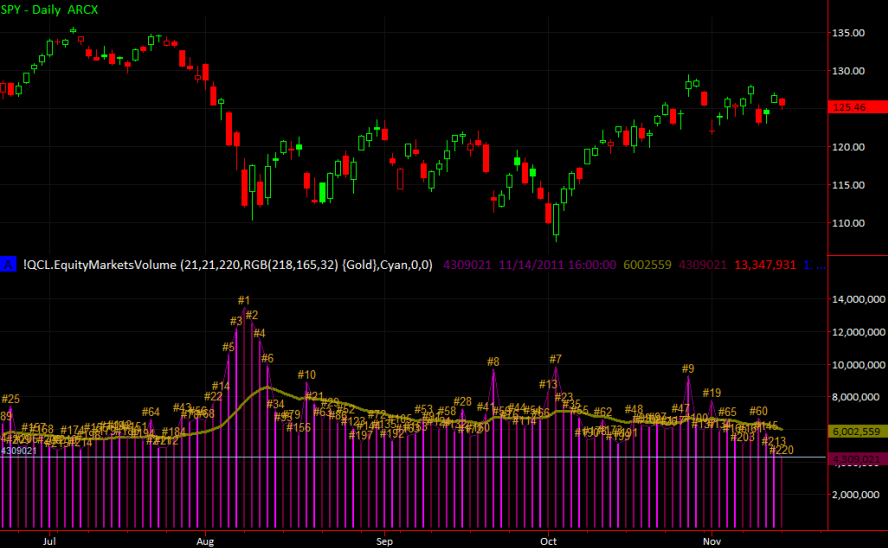
CNBC reported after close that today (November 14th 2011) had the lowest trading volume (for US Equities) this year. They were right as can be seen in the following chart using the EquityMarketsVolume indicator:

EquityMarketsVolume for 2011 as of November 14th

Today ranked #220 or 220 trading days this year, with 4.3 billion shares trading hands. Less than the 6.0 billion 21-day moving average. And much less than the #1 all-time trading volume day (October 10, 2008) where 18.8 billion shares changed hands.

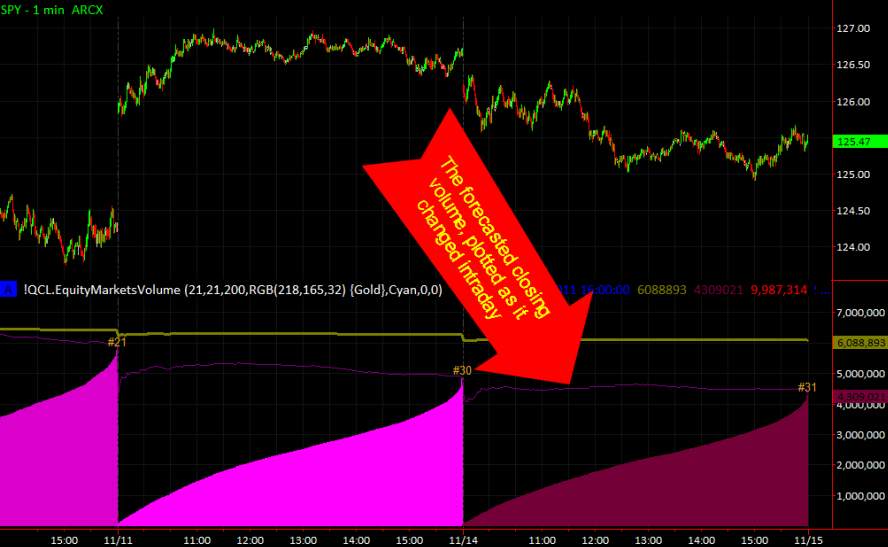
The reason we knew the headline hours beforehand, was due to real-time forecasting by the indicator as can be seen on the intraday plot here:

EquityMarketsVolume forecast intraday

Note that the #31 rank in the second plot is for a 31-day period. The forecasted 4.3 billion shares range was established by 9:50 AM ET. This was less than the previous 2011 low of 4.5 billion traded on April 25th.

So for all the times we’ve heard trading volume figures abused, today CNBC got it right.

As to trading implications. With a pennant formation in SnP prices, around long-term support-resistance levels, declining volumes just mean that a decision is coming. Buyers and sellers see things very differently. Will the October rally resume?