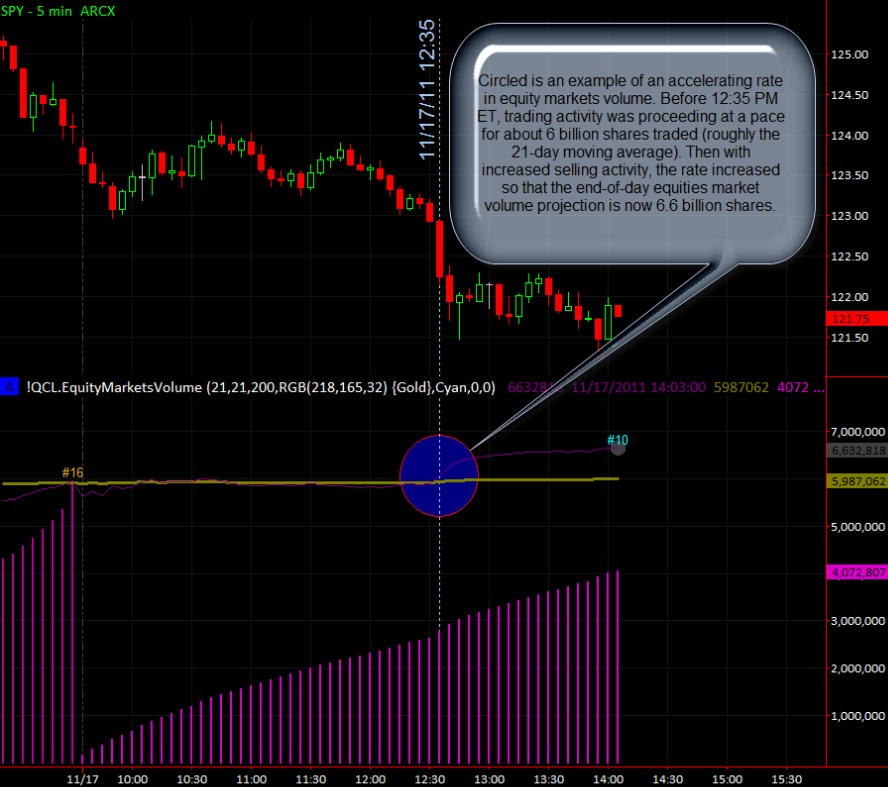
In the image below, circled is an example of an accelerating rate in equity markets volume. Before 12:35 PM ET, trading activity was proceeding at a pace for about 6 billion shares traded (roughly the 21-day moving average). Then with increased selling activity, the rate increased so that the end-of-day equity markets volume projection is now 6.6 billion shares.
Note that the #10 ranking is for the last 31 trading days. It is the first day in over a week to trade at a rate above the 21-day moving average, but this is still a relatively slow pace of trading.
The above chart was produced with the default workspace of the EquityMarketsVolume indicator available on the TradeStation Strategy Network.
