!QCL Solutions

Scalable Solutions for Institutional-Level Trading

Dynamic Link Libraries like ELExcel.dll on the TradeStation forums, and other such dlls typically communicate with the first instance of Excel only. However, one can accidentally create multiple instances of Excel by opening different Excel workbooks.

A solution to this issue is to interact with multiple instances of Excel from TradeStation using the XLInputs.dll (sold here).

A further solution is to avoid multiple Excel instances with the KeepSingleInstance Add-On product for Excel. The Excel Add-On allows you to easily open multiple Excel documents without the hassle of having to open them through the file menu of the open instance.

As stated above XLInputs has been enhanced to interface with multiple instance of Excel. However, working with multiple instances increases cpu loads. So it remains advisable to keep workbooks in a single instance of Excel when interfacing actively with TradeStation or MultiCharts.

For Excel 2003: Run Setup_Excel_KeepSingleInstance03.msi

For Excel 2007 & 2010: Run Setup_Excel_KeepSingleInstance07.msi

Here is an installation video for Excel 2007 & 2010 users:
Excel_KeepSingleInstance Installation for Excel 2007 (& 2010)

The process is similar for Excel 2003 users who would install Setup_Excel_KeepSingleInstance03.msi.

Note that with the Add-On, it is still possible to open multiple instances of Excel if you like. This is done by repeatedly launching the Excel.exe program directly or through shortcuts.
Question:
value1 = highest(high,30);
How can I modify the above to find the highest high for bar range of 10 through 30 bars ago?

Answer:
First of all, note that in EasyLanguage Highest(High, 30) returns the highest High value of the referenced datastream, between the current bar and the 29th previous bar (i.e. between High[0] and High[29]). So, if you want to know the highest high between 10 bars ago and 30 bars ago, you could use an EasyLanguage statement like the following:
value1 = Highest(High,21)[10];
That returns the highest High between High[10] and High[30].

The following statement return the same value:
value1 = Highest(High[10],21);

Regards,
David O’Dell

Confirm TradeStation Version and Build

Importing the ELD and inserting the Strategy in a Chart:
TradeStation 8.7 Importing of the ELD
Insert the imported Strategy into a Chart, TradeStation 8.7

Trading Overview

Inputs Overview

Optimization Overview

Automation: Getting Started

Automation: TradeManager – Strategy Orders tab

Advanced Automation:
Automation: TradeManager – Strategy Orders tab, 9/2/2010
Advanced Automation with and without Confirmation pop-ups, 9/2/2010

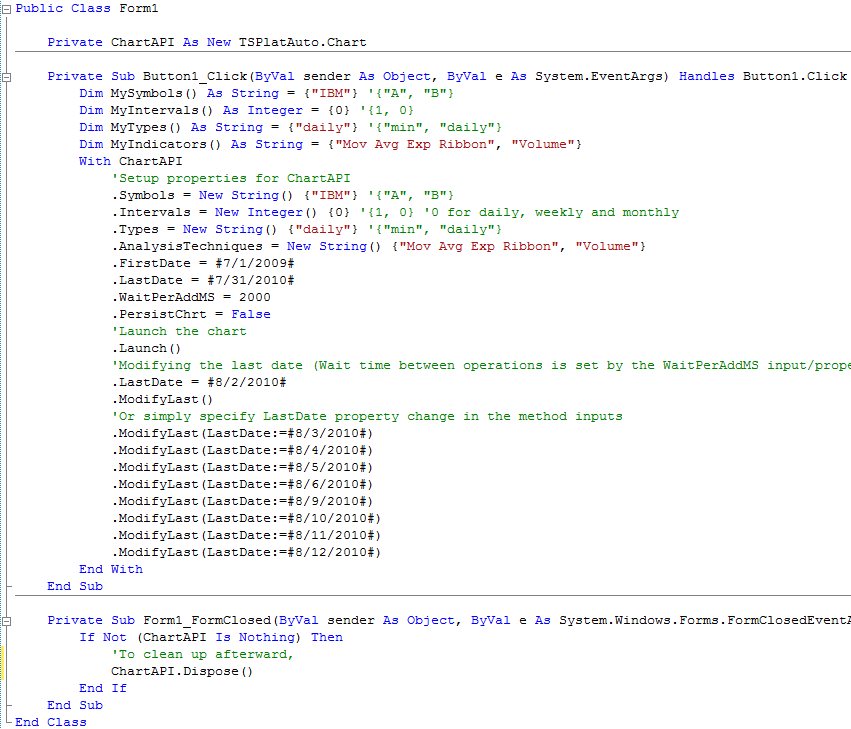
Launch a TradeStation Chart, setup data, insert indicators, change date range and more with !QCL Solutions TSPlatAuto.Chart Class

TSPlatAuto_UsageDemo-WinForm

Using !QCL Solutions TSPlatAuto.Chart class

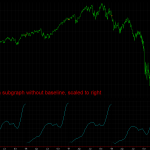
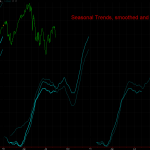
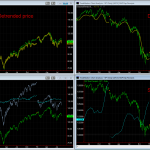
Here are example views of the SeasonalTrends indicator with SPY daily data developed for TradeStation. It averages annual trends starting from a user specified date. All the examples start from 1/1/1994. The displayed workspaces and other are installed along with the SeasonalTrends TradeStation Add-On product.

The Add-On product is of known interest to followers of Larry Williams, especially those who have used Seasonal Trends with Trade Navigator. However, it was not designed to mirror the look and feel of that product.

I welcome your suggestions for the SeasonalTrends indicator. We can also make custom versions.

Regards,
David O’Dell

Here is video developed for a customer, demonstrating how to use XLInputs to easily create a custom TradeStation Strategy Optimization. The methods enable smart optimizations, with all records maintained in Excel. If you need to start and restart an optimization, Excel keeps track and resumes where it was stopped.

StratOptiByXLinputs1

You can even take such optimization methods to the next level, with external code or EasyLanguage functions to choose the next set of inputs based on performance.

Here is video of me using data from RealtimeRecords in a demo Visual Studio solution. The recording was made for a specific customer, but the content is useful to anyone integrating RealtimeRecords data with their own applications.

ForGordon201008062130a

I show how to run a demo application in debug configuration, release configuration and after installation.

Here is video instruction for using the Data Service of the RealtimeRecords application, along with setup instructions for capturing messages from TradeStation:

RealtimeRecords_DemoAndNotificationsSetup

!QCL Solutions, LLC

347-7GO-1QCL

347-746-1725

[email protected]

To be of best service, phone calls are generally recorded.

Question: A customer asked, “How do I make OHLC bars with my indicator?”

Answer: This can be accomplished with real time data. Your indicator needs to track Open, High and Low values with intrabarpersist variables. It also needs to track when the bars of source data streams close. That way your indicator can determine when the opening tick occurs, and when to reset the high and low variables.

Here is an example EasyLanguage indicator, creating bars for (Up Volume – Down Volume) values:

{
DEMO
By: David O’Dell
[email protected]
!QCL Solutions
P.O. Box 2304
Palm City, FL 34990
347-746-1725

For intraday and tick bars only.

.iat MyRTHighLow
}
Input:
 DataNum(1),
 AvgLength(50),
 NumDevs(1),
 ShowBaseline_ok1(1),
 Baseline(0);

Const: int BogusValue(9999999);

Variables:
 MyValue(0), MyAvgValue(0), MyStDevValue(0),
 vShowBaseline(ShowBaseline_ok1=1),
 intrabarpersist Op(BogusValue),
 intrabarpersist HH(0),
 intrabarpersist LL(BogusValue),
 intrabarpersist OnPriorBarClosed(True);

MyValue = UpTicks – DownTicks {example calculation};
MyAvgValue = Average(MyValue, AvgLength);
MyStDevValue = StandardDev(MyValue, AvgLength, 2);

if (GetAppInfo(aiRealTimeCalc) = 1) then
begin
 if OnPriorBarClosed then
 begin
  Op = MyValue;
  HH = MyValue;
  LL = MyValue;
 end
 else
 begin
  HH = MaxList(MyValue, HH);
  LL = MinList(MyValue, LL);
 end;
 if Op <> BogusValue then
  Plot1(Op, “RTOpen”);
 Plot2(HH, “RTHigh”);
 Plot3(LL, “RTLow”);
end;
Plot4(MyValue, “RTClose”);
Plot5(MyAvgValue, “AvgClose”);
Plot6(MyAvgValue + NumDevs * MyStDevValue, “UpperBand”);
Plot7(MyAvgValue – NumDevs * MyStDevValue, “LowerBand”);

if ((GetAppInfo(aiApplicationType)=cChart) and vShowBaseline) then
 Plot11(Baseline, “Baseline”);
OnPriorBarClosed = (BarStatus(DataNum) = 2);

 Note that property settings for this indicator are important.

I’ll email the zipped folder to you. Send the request below.
Or email request directly to [email protected].

Request:


Regards,

David O’Dell